Reports & Usage
Path: /dashboard/analytics · Permission: Analytics module
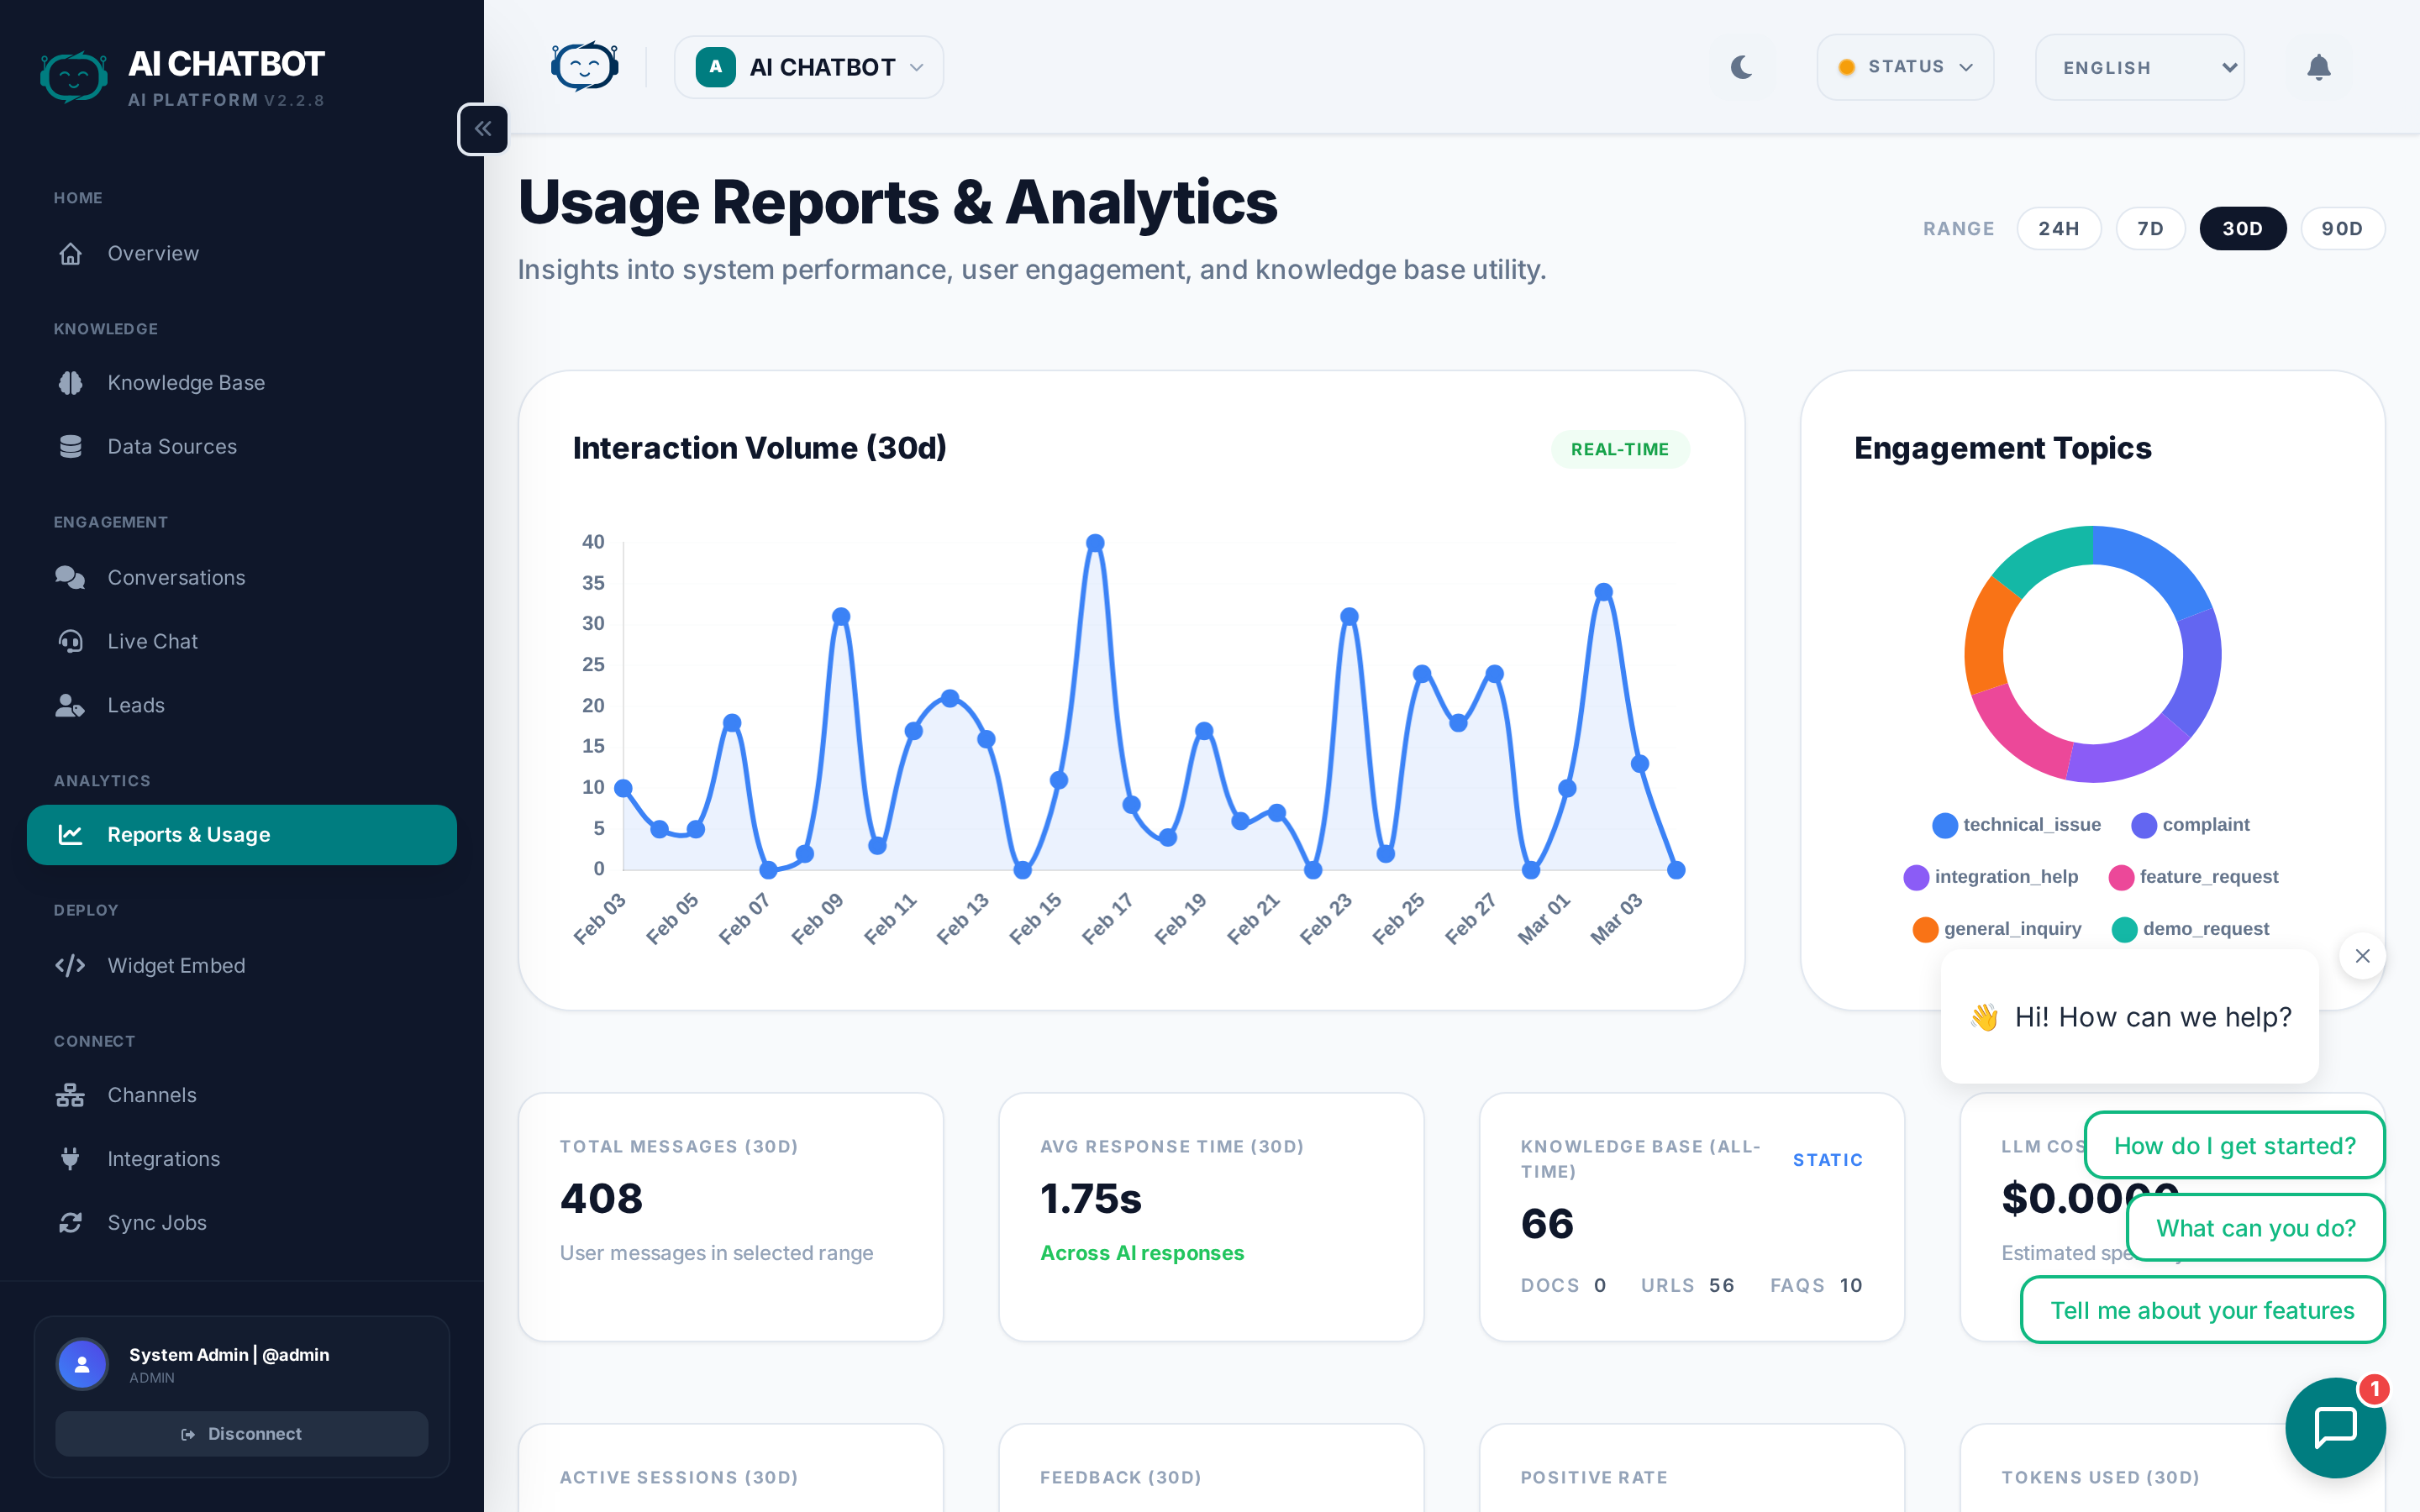
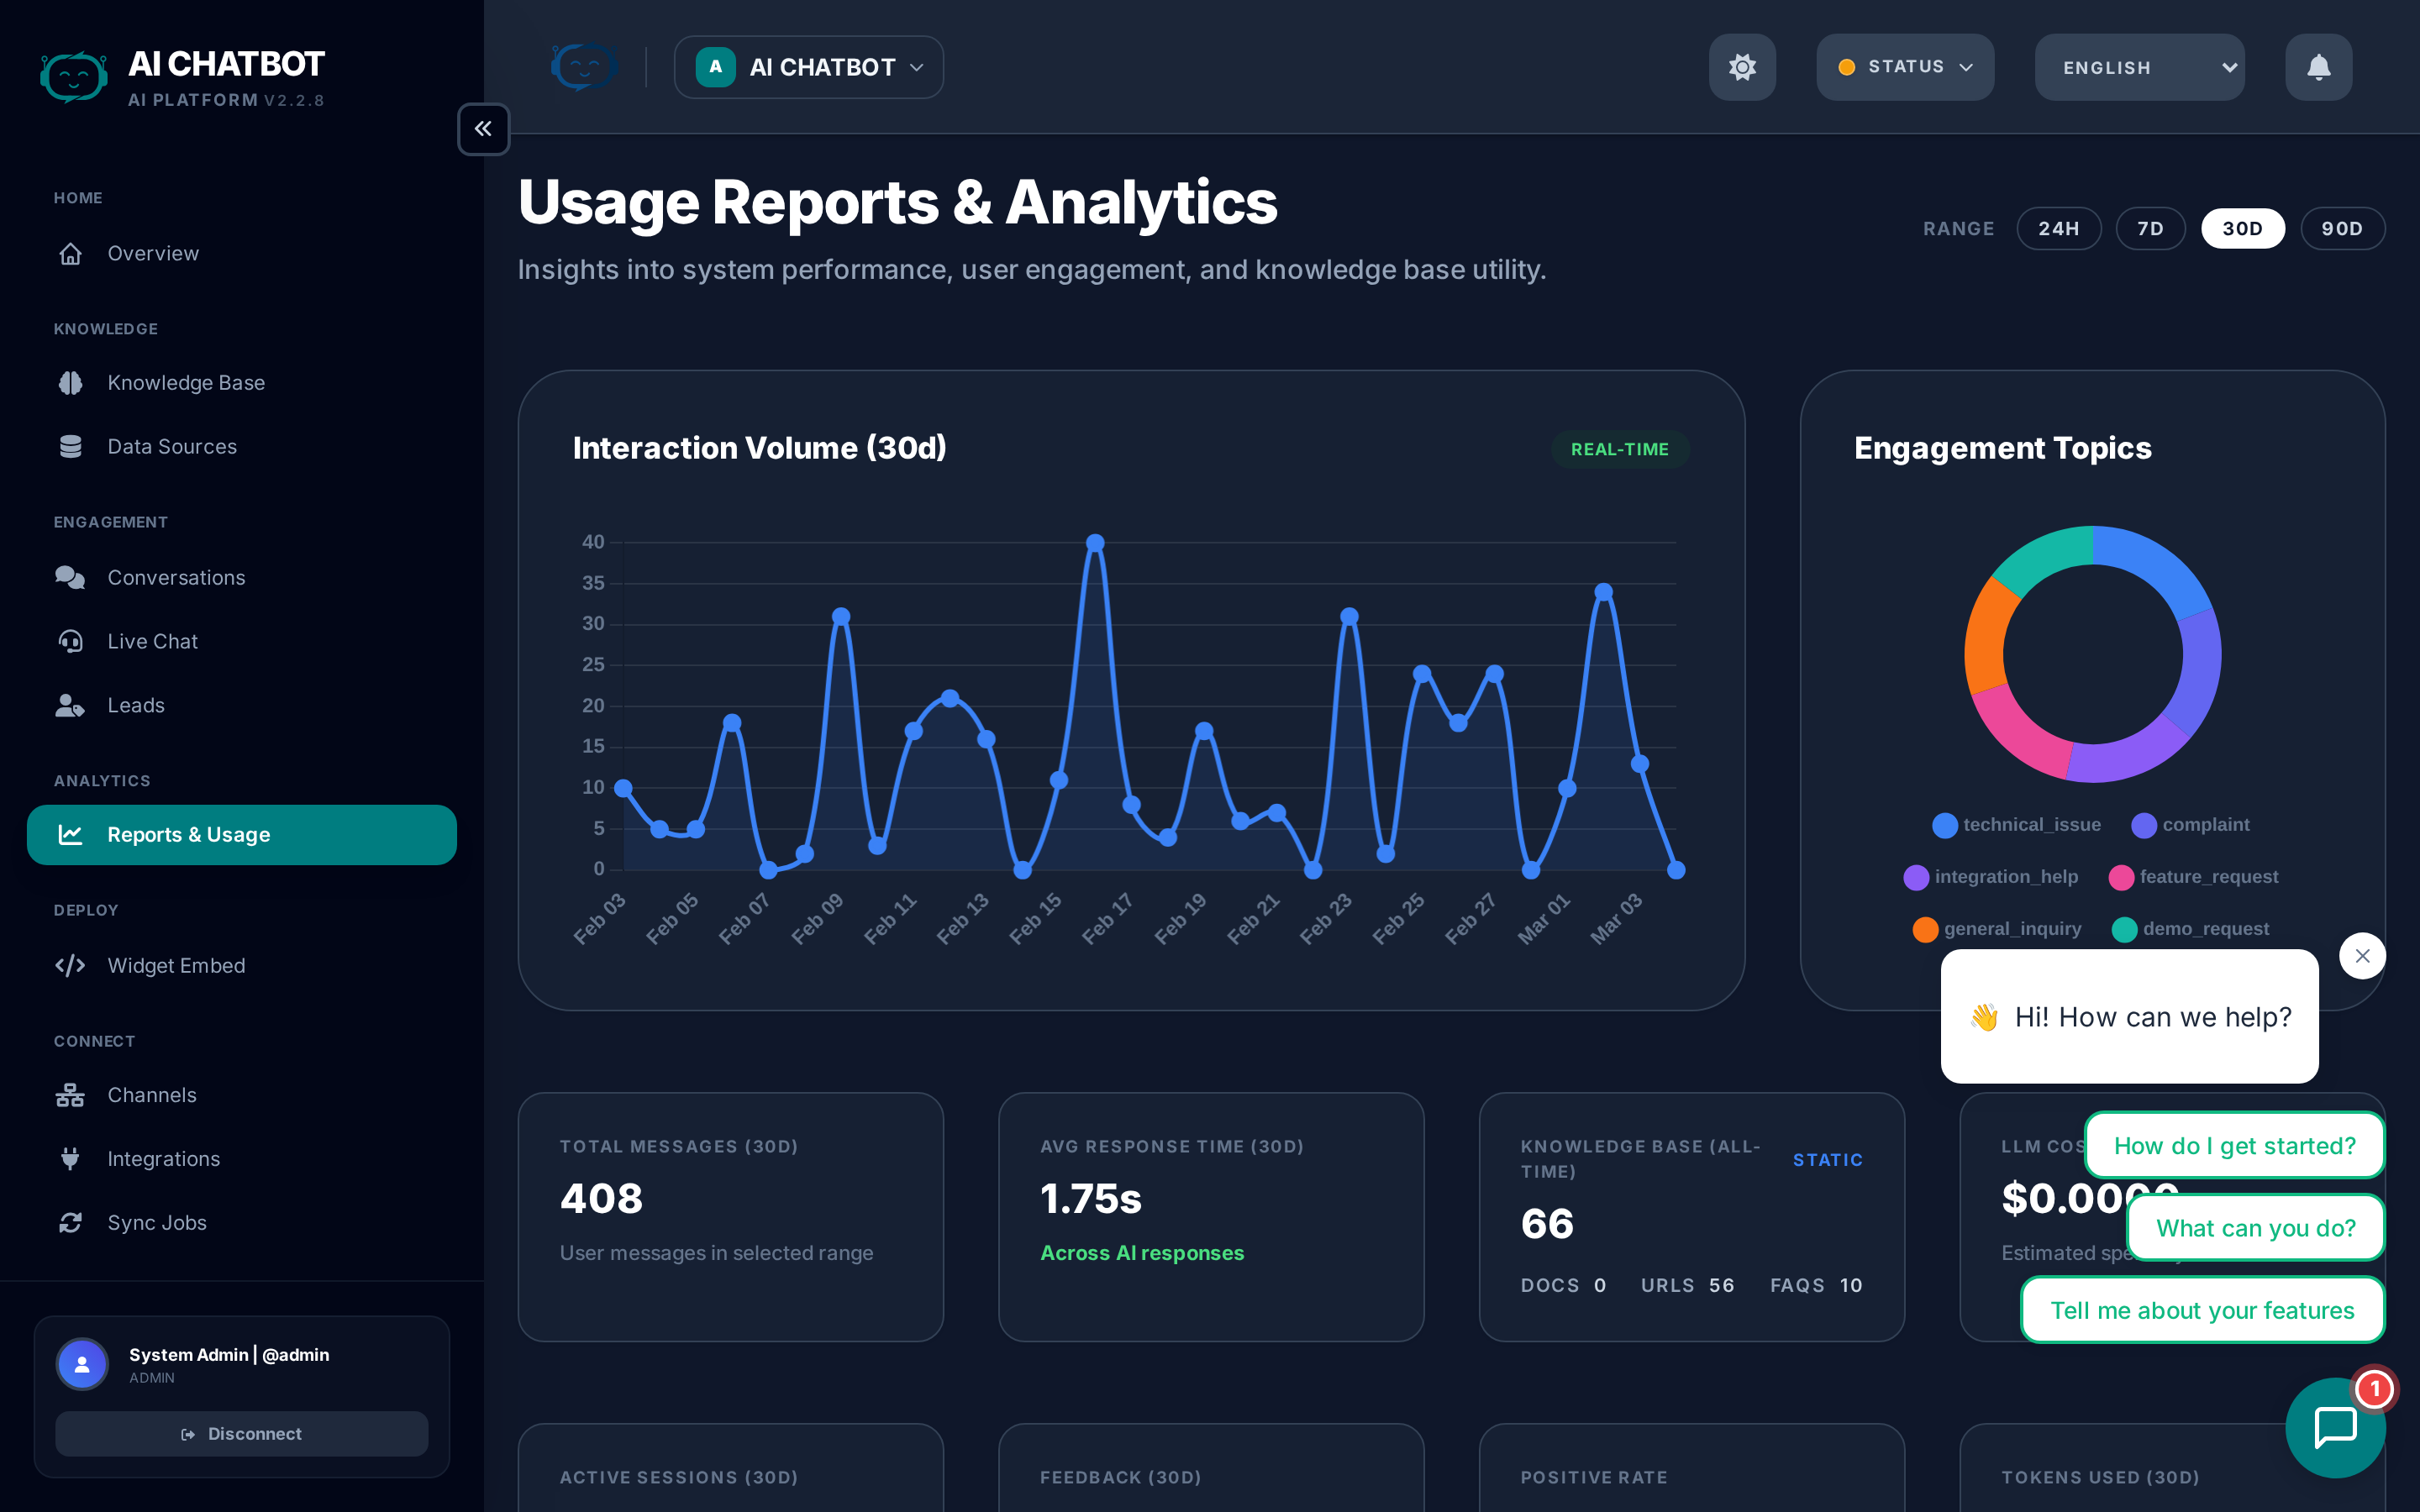
The Analytics dashboard provides insight into how your AI assistant performs, how users engage with it, and where conversations convert into leads. Use this data to optimize your knowledge base, AI model, and lead capture strategy.
Date range selector
Use the range buttons in the top-right corner to control the time window for all charts and metrics on this page:
| Range | Shows data from |
|---|---|
| 24h | The last 24 hours |
| 7d | The last 7 days |
| 30d | The last 30 days (default) |
| 90d | The last 90 days |
All cards, charts, and counters update instantly when you switch ranges. The selected range is shown in parentheses next to each section header.
Interaction Volume chart
The large chart at the top-left shows sessions and messages over time as a line/bar chart. Each data point represents one day (or one hour in 24h mode).
How to read it:
- Rising trend → Your bot is getting more usage — make sure the knowledge base keeps up.
- Spikes → Correlate with marketing campaigns, product launches, or support events.
- Flat line at zero → The widget may not be deployed, or the bot isn't reachable.
The chart updates in real-time — a green badge confirms this.
Engagement Topics
The donut chart at the top-right shows the distribution of user intents — what categories of questions people are asking most. Topics are detected automatically by the AI and displayed as a percentage breakdown.
How to use this:
- If one topic dominates, add more FAQs and documents for that subject.
- If "general" or "unknown" is high, your knowledge base may need broader coverage.
Metric cards (Row 1)
The first row of metric cards shows:
| Card | What it measures | What to watch for |
|---|---|---|
| Total Messages | Number of user messages in the selected range | Sudden drops may indicate a widget or server issue |
| Avg Response Time | How fast the AI responds, in seconds | Under 3s is good; over 8s — consider a faster model |
| Knowledge Base | Total indexed items (all-time), broken down into Docs / URLs / FAQs | If this is 0, the bot has nothing to answer from |
| LLM Cost | Estimated AI provider spend for the selected range | Track this to stay within your OpenRouter budget |
Metric cards (Row 2)
| Card | What it measures | What to watch for |
|---|---|---|
| Active Sessions | Distinct user sessions in the selected range | Compare with Total Messages to gauge conversation depth |
| Feedback | Total user ratings received | Low count means the feedback module may be disabled |
| Positive Rate | Percentage of positive (👍) vs negative (👎) feedback | Below 70% — review negative conversations to find gaps |
| Tokens Used | Combined input + output tokens consumed | High token usage drives cost — reduce Max Tokens or switch models |
Conversion funnel
The funnel tracks how visitors progress from opening the widget to becoming a lead. Each stage shows a count and a conversion rate percentage:
| Stage | What it counts | Rate shows |
|---|---|---|
| Widget Opens | User clicked the chat bubble | 100% (baseline) |
| Chat Starts | User sent their first message | % of opens that became chats |
| Live Chat Sessions | Conversations with 3+ exchanges | % of chats that became engaged |
| Leads Captured | User submitted the lead form | % of live chats that captured a lead |
Healthy conversion benchmarks
| Conversion | Healthy range | If below range |
|---|---|---|
| Open → Start | 40–60% | Improve your welcome message and suggested questions |
| Start → Live Chat | 30–50% | Improve knowledge base coverage — users are dropping off |
| Live Chat → Lead | 15–30% | Enable or optimize the lead form, add handoff for high-value conversations |
Reading the funnel
- High opens, low starts → The widget is visible but the welcome copy isn't compelling enough to start a conversation.
- High starts, low live chats → Users are asking questions but not getting useful answers. Review Conversations to identify gaps.
- High live chats, low leads → Conversations are productive but you're not capturing contact info. Enable the lead form in Settings → Lead Form.
Top User Interests
Shows the top 5 topics users are asking about in the selected range, ranked by hit count. Each topic is auto-detected by the AI's intent classifier.
How to use this:
- Focus your knowledge base improvements on the #1 and #2 topics.
- If a topic appears that your bot shouldn't handle, update the system prompt to redirect or decline.
LLM Usage breakdown
Two side-by-side panels give you visibility into AI model consumption:
LLM Usage (by model)
Shows each AI model used in the selected range with:
- Model name (e.g., DeepSeek/DeepSeek-V3)
- Number of API calls
- Tokens consumed (in thousands)
- Estimated cost in USD
Tip: If one model is consuming most of your budget, consider switching to a more cost-effective option. See AI Models.
LLM Tasks Breakdown (by purpose)
Shows how tokens are distributed across different system tasks:
| Task | What it does |
|---|---|
| chat | Main conversation responses |
| summary | AI-generated conversation summaries for leads |
| intent | Topic classification for analytics |
| embedding | Knowledge base indexing |
If "chat" dominates, that's normal. If "embedding" is high, you may be re-indexing frequently.
Optimization tips
Based on what the analytics tell you:
- Add FAQs for the top user interests — This speeds up responses and improves accuracy for common topics.
- Switch to a faster model if average response time exceeds 5 seconds — see AI Models for low-latency options like Gemini Flash or Claude Haiku.
- Enable the lead form if live chat sessions are high but lead capture is low.
- Review low-rated conversations (click through from the Feedback card) to identify where the bot struggles and update your knowledge base accordingly.
- Refine your system prompt if the bot's tone or answer format isn't meeting expectations.
- Monitor LLM cost and switch to budget-friendly models (DeepSeek V3, GPT-4o Mini) for high-volume bots.
FAQ
Q: Why are analytics blank?
- The bot hasn't received enough sessions yet, or you're looking at a date range with no activity. Try expanding the range to 90d.
Q: What counts as a "live chat session"?
- A session with 3 or more back-and-forth messages (user + bot exchanges). Single-message sessions are counted as "chat starts" but not "live chat sessions."
Q: Are analytics per-bot or global?
- Per-bot. All analytics are scoped to the currently selected bot workspace. Switch bots using the workspace dropdown to compare.
Q: How often are analytics updated?
- Analytics update in real-time as conversations happen. Refresh the page to see the latest data.
Q: How is LLM cost calculated?
- Cost is estimated based on the token counts and the per-token pricing of each model from OpenRouter. FRENZY.BOT adds no markup — the cost shown matches what OpenRouter charges.