Overview (Dashboard)
Path: /dashboard/ · Permission: All roles
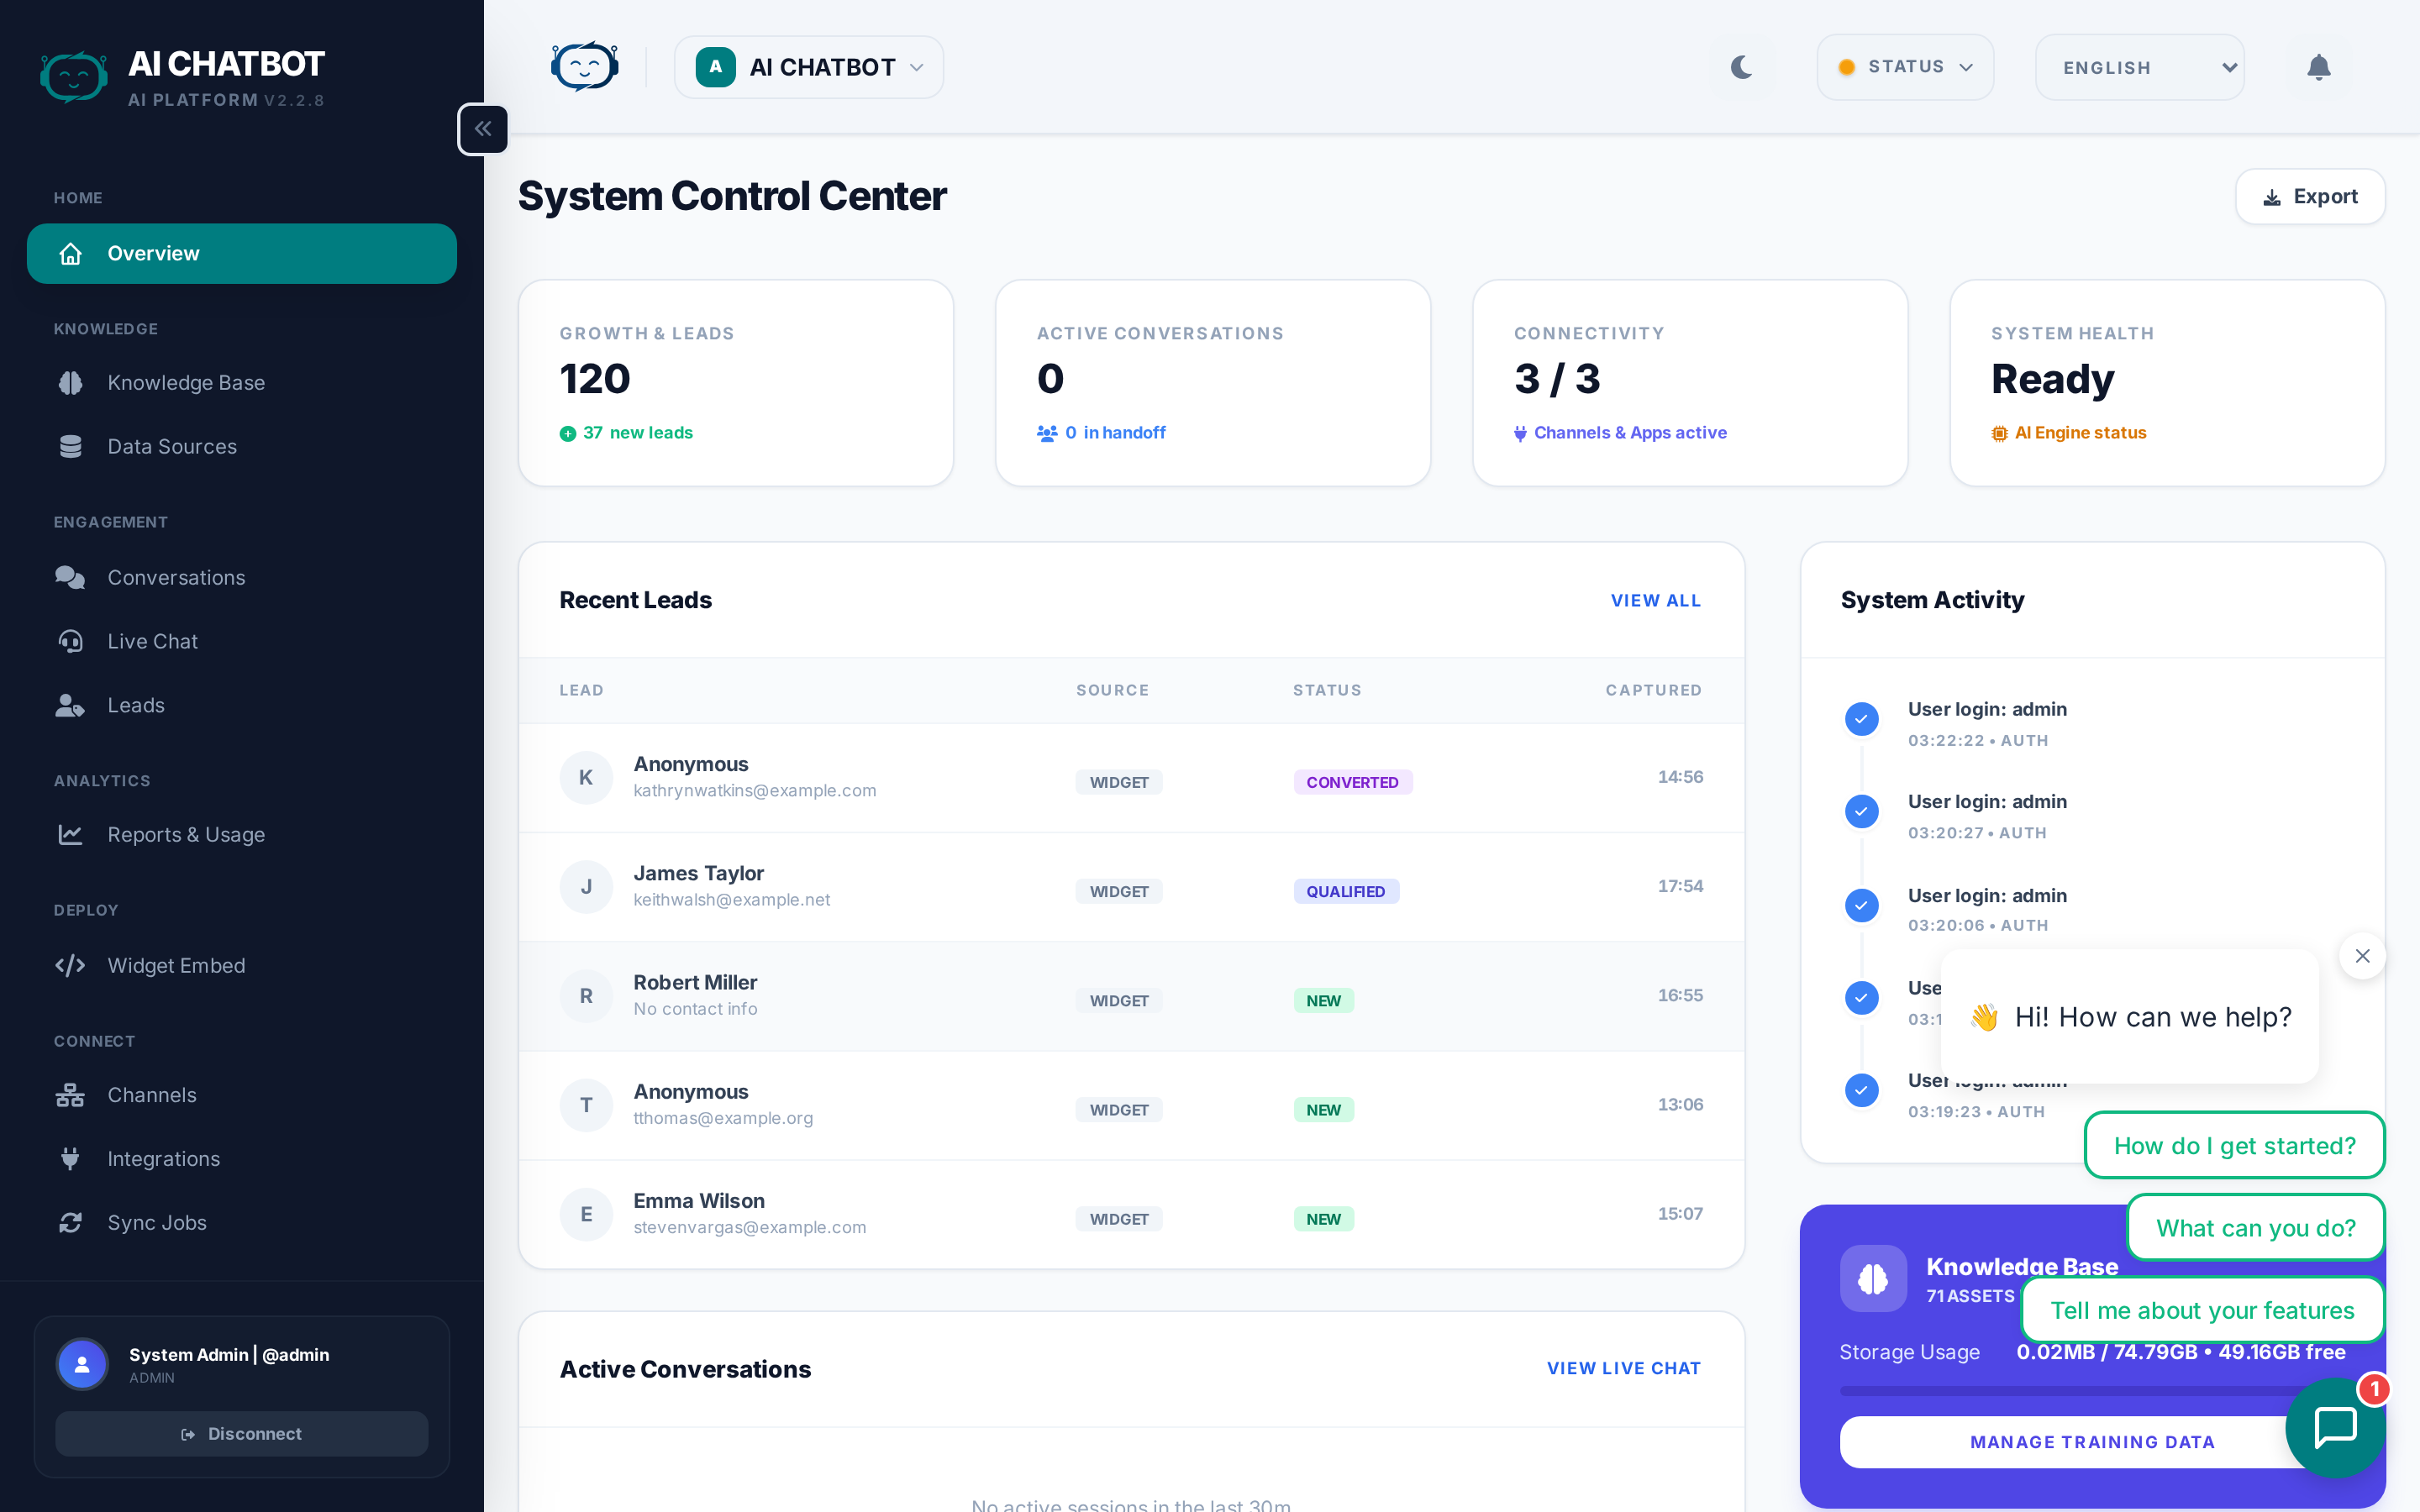
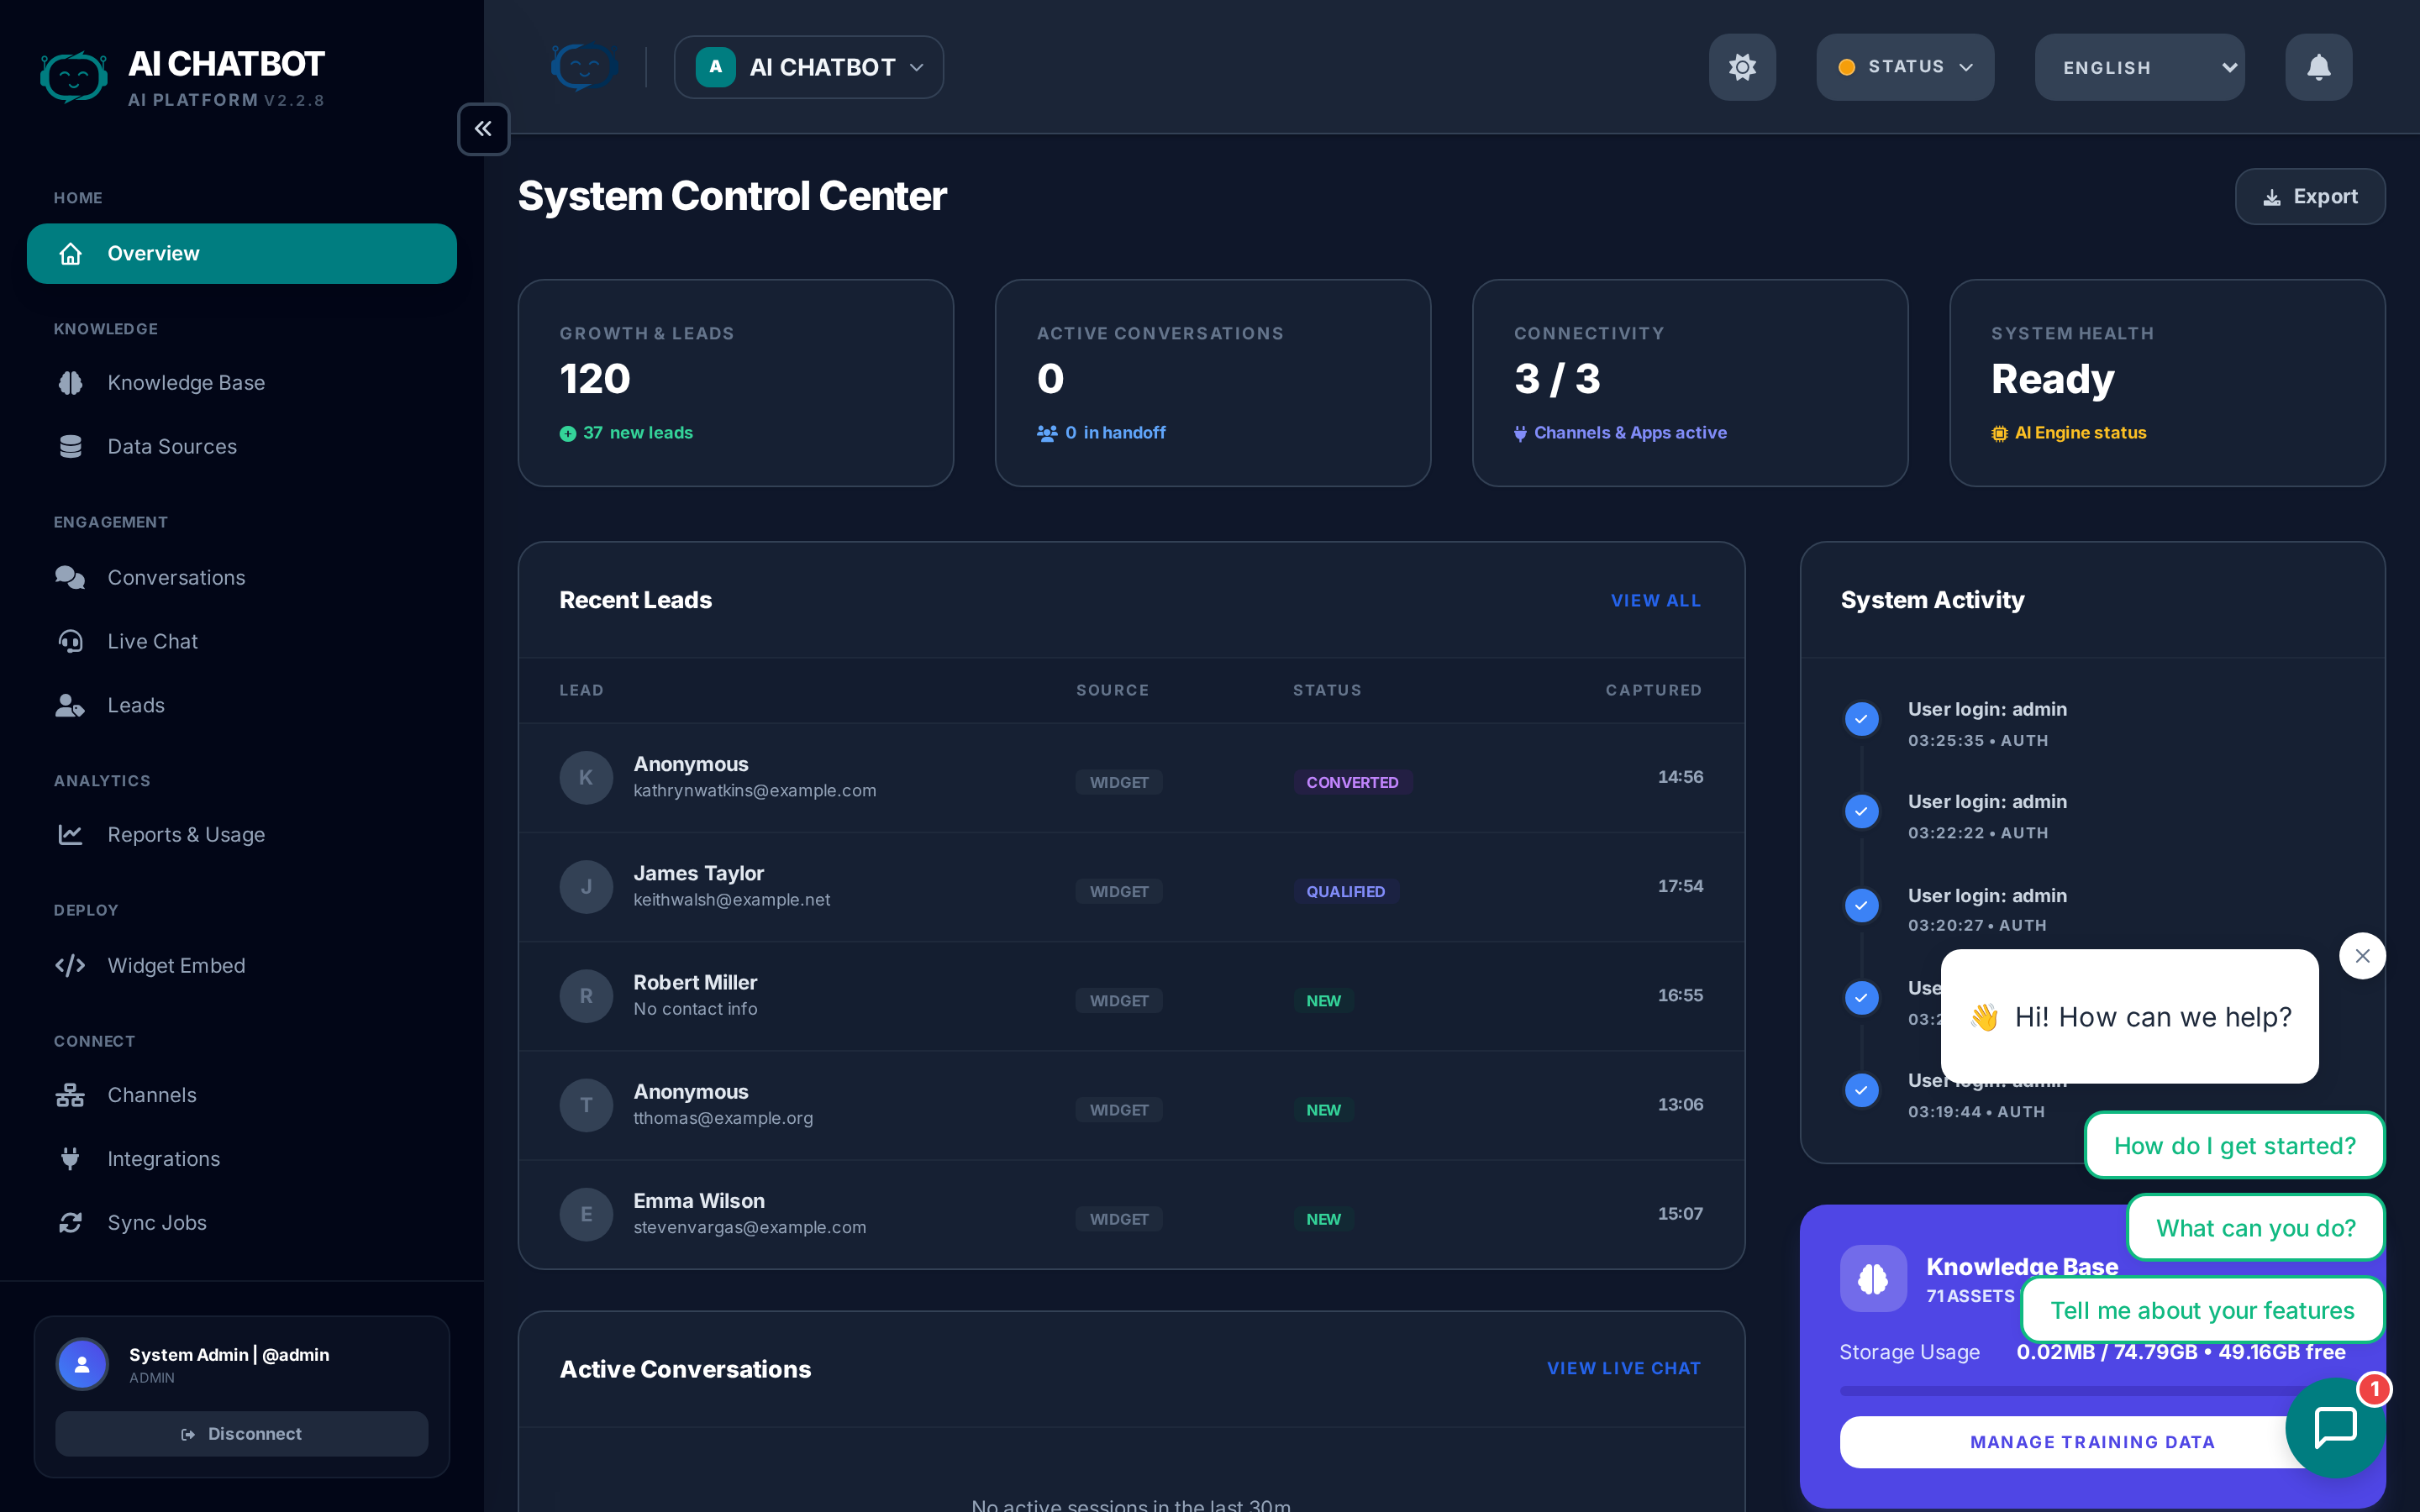
The Overview page is your FRENZY.BOT command center. It gives you a real-time snapshot of system health, usage volume, knowledge base status, and whether the AI is ready to respond — all on one screen.
What this page answers
- Is the system healthy and connected?
- Are people actively chatting with the bot?
- Is the knowledge base loaded and indexed?
- Are response times and usage trending up or down?
System health indicators
At the top of every dashboard page, three status indicators show whether core components are online:
| Indicator | What it checks |
|---|---|
| DB | Database connectivity and query health |
| VEC | Knowledge base search engine availability |
| LLM | Connection to your selected AI provider via OpenRouter |
- Green = healthy and operational.
- Red = disconnected or unreachable.
If any indicator is red, the bot may load but will not answer questions correctly.
What to do if an indicator is red
| Problem | Action |
|---|---|
| DB is red | Contact your account manager — the database service may need attention. |
| VEC is red | Contact your account manager — the vector search service may need attention. |
| LLM is red | Go to Settings → AI Engine and reconnect OpenRouter or verify your API key. |
Key metrics
The Overview displays real-time counters for the current bot:
- Total Sessions — Unique chat conversations initiated by users across all channels.
- Total Messages — Total messages exchanged (user + bot responses combined).
- Knowledge Base Size — Number of indexed documents and total data volume in MB.
- Active Sessions — Conversations happening right now.
- User Feedback — Satisfaction summary when the feedback module is enabled.
Multi-bot awareness
All metrics are scoped to the currently selected bot. Switch bots using the workspace dropdown in the header to see metrics for a different bot. See Multi-Bot Workspaces for details.
Knowledge base summary
The Overview includes a quick snapshot of your knowledge base health:
- Files — How many documents are uploaded and indexed.
- URLs — How many web pages are being tracked.
- FAQs — How many Q&A pairs are active.
If any section shows 0 or N/A, the bot may not have enough data to answer questions accurately. Go to Knowledge Base to add content.
Operational tips
- Review this page after every deployment or settings change to confirm nothing broke.
- If sessions are high but leads are low, revisit your lead form settings and widget welcome prompts.
- If messages are high but sessions are low, users are having long conversations — consider improving FAQ coverage to give faster answers.
- Use the Analytics page for deeper funnel metrics and trend charts.
FAQ
Q: The Overview loads but other pages are empty.
- The database or vector store is likely disconnected. Check the health indicators at the top and follow the quick fixes above.
Q: Why does knowledge base size show 0?
- Files, URLs, or FAQs may not be indexed yet. Go to Knowledge Base and upload content, then wait for sync jobs to complete. Check Sync Jobs for status.
Q: Metrics seem outdated or frozen.
- Refresh the page. If metrics still don't update, check that PostgreSQL is running and the database connection is healthy.